Cycles
Two models claiming history runs in beats. One of them is mine. Both are set out here together with what argues against them.
OL-DEThe 28-year beat
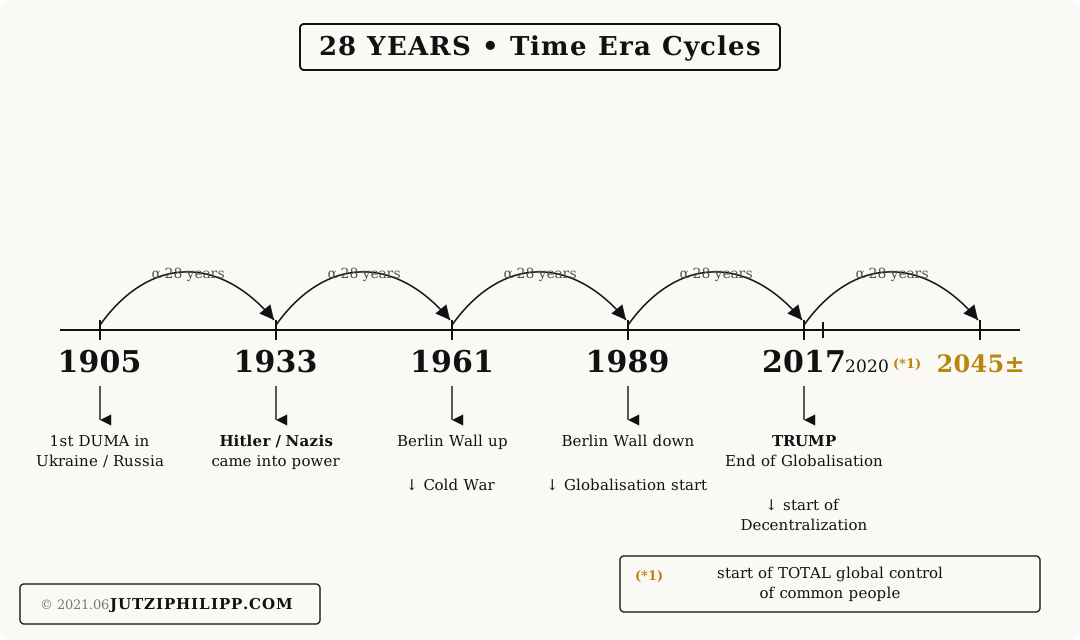
My own timeline, drawn in 2021. Five marks, 28 years apart: 1905 the first Duma, 1933 the Nazis taking power, 1961 the Berlin Wall going up, 1989 its fall, 2017 Trump taking office and the end of the globalisation phase. The next point falls on 2045.
This is not academic work and does not present itself as such. It is an observation: the gaps between these events are strikingly even, and each event marks a change in the political order itself, not merely a change of government.
OL-DE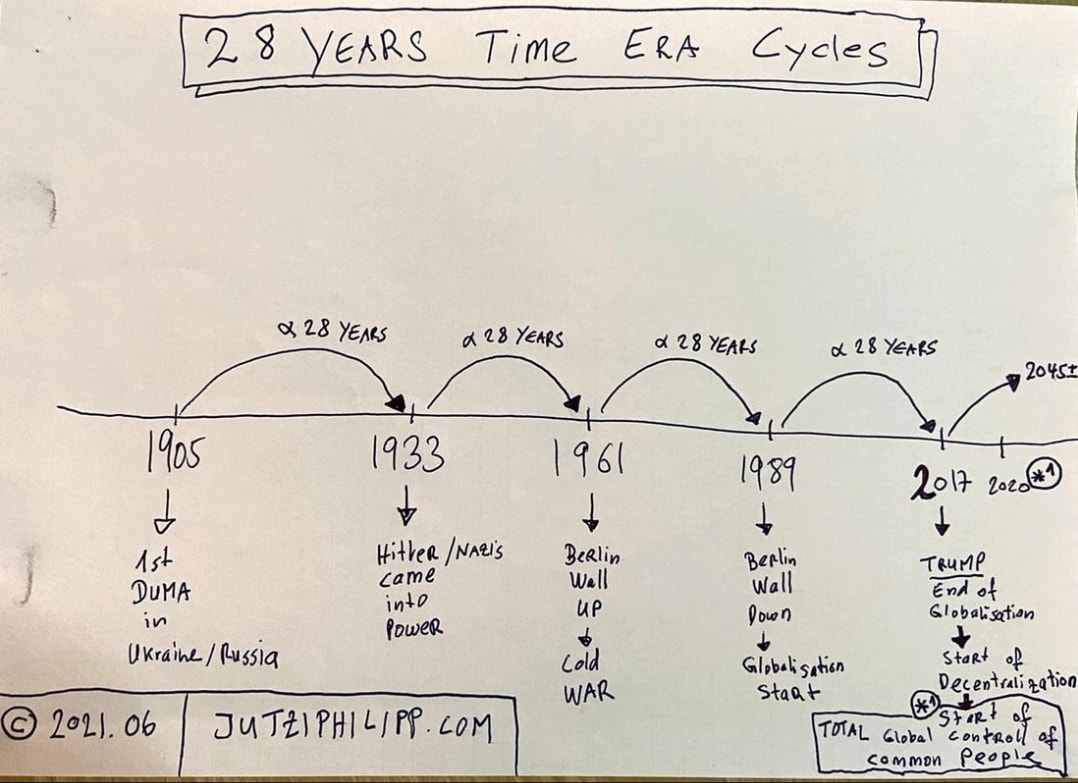
The 80-year beat
Separately there is an older and far better known model: the generational theory of William Strauss and Neil Howe. It describes a saeculum of roughly 80 to 100 years – about one long human lifespan – divided into four phases of some 20 to 25 years each.
The four phases are High, Awakening, Unraveling and Crisis. The Crisis is the phase in which the existing order is not repaired but replaced. As Anglo-American anchors the authors name the Glorious Revolution, the American Revolution, the Civil War, and the Depression together with the Second World War. Howe dates the current Crisis as beginning in 2008.
The mechanism behind it is the more interesting part: caution is learned from catastrophe and dies with the people who lived through it. Once nobody in office personally remembers the last disaster, the institutional caution built from it falls away. That takes about a lifespan. The idea is neither new nor exclusive – Hyman Minsky described the same thing for financial crises.
OL-DEBoth beats in one picture
The big wave is the 80-year beat, the small one riding on it is the 28-year beat. The slider picks the year, the buttons pick the span – from 30 years out to 1600, about six saecula.
OL-DEModel curves, not a measurement. The big wave rises slowly across High, Awakening and Unraveling and then falls steeply through the Crisis: 63 years of build-up, 21 of collapse. Peak on the Crisis start, trough on the Crisis end. The small wave is the 28-year beat and only begins in 1905 – there are no marks before that, so there is no line.
Drag the slider, the buttons zoom
Where the two touch
The two models do not claim the same thing. 28 and 80 do not resolve into one another. But they grip the same dates: 1933 and 1989 sit at marked positions in both systems, and both place the current upheaval in the present – mine from 2017, Howe from 2008.
What both share is the underlying assumption: political orders last about as long as the memory of how they were made. What neither delivers is a prediction with a date on it.
OL-DEThe beat ought to be stretching
If the driver really is living memory, something awkward follows for the model: a population living considerably longer ought to carry a longer cycle. US life expectancy was 47 years in 1900, 68 in 1950, 77 in 2000 and is around 79 today. That is a good three decades added inside the very span Strauss and Howe draw their anchors from.
In the model the beat does not stretch. The four phases stay at 20 to 25 years and the saeculum at about 80, across four centuries. Either memory is not the mechanism, or the calendar would have to be adjusted as it goes. Neither is in the book.
The honest objection to the objection: the big gain comes from children surviving, not from adults lasting longer. Someone who reached twenty in 1900 could expect about 62, today about 79. That is not quite 17 years added rather than 32. For a memory argument only the second figure counts, since infants hold no office. So the stretch would be smaller than the headline, but real: roughly a fifth longer, which would turn 80 years into about 95.
OL-DEThe case against
- The sample is too small. Anglo-American history since 1600 yields five or six saecula. You cannot establish a cycle from five data points – almost any period length could be fitted in. The same applies to my own five marks.
- The model is hard to falsify. Phase boundaries get moved retroactively so they match events. When the 1990s failed to produce the predicted Crisis, the Unraveling was simply extended. A model that absorbs every outcome predicts none.
- There is one clean miss. Strauss and Howe put the Crisis at around 2005, resolving by the mid-2020s. 2008 is close enough to claim – but the resolution date has since slid into the 2030s.
- It is narrowly Anglo-American. Applied to China, Russia or the Ottoman world the phases do not line up. A cycle that works in one cultural sphere describes that sphere, not history.
- Rising life expectancy ought to stretch the beat if memory really is the driver. In the model it does not.
- Academic history largely ignores the theory. It is read mainly by investors and in political commentary.
- Which events count as a Crisis is the authors' own choice. Two world wars sit in one phase, yet the First World War does not count as a Crisis of its own. Without a fixed rule for that, the sequence can be made to fit.
- There is no mechanism behind the four generational archetypes, only the description. Why exactly four, and why in that order, is never derived.
- The audience wants it to be true. A model announcing an oncoming crisis finds more agreement among investors and political commentators than one predicting nothing. That is not a refutation, but it is a reason to look harder at the confirmations.
What is left standing
The mechanism, not the calendar. That institutional caution lasts roughly a lifespan and is dismantled afterwards is plausible and partly measurable. That this becomes a timetable with years attached is not.
I keep my 28-year beat as what it is: an observation across five points that helps me order things. Not a forecast. Turning a pattern into a prediction means the pattern has already been overstretched.
OL-DESources
- William Strauss, Neil Howe: Generations. The History of America, 1584 to 2069. William Morrow, 1991.
- William Strauss, Neil Howe: The Fourth Turning. An American Prophecy. Broadway Books, 1997.
- Neil Howe: The Fourth Turning Is Here. Simon and Schuster, 2023.
- Hyman P. Minsky: Stabilizing an Unstable Economy. Yale University Press, 1986 (financial memory and risk appetite).
- Own timeline 28 YEARS - Time Era Cycles, hand drawing, 2021.06, own website.
- Centers for Disease Control and Prevention / NCHS, US life expectancy 1900 to 2024 (47.3 in 1900, 68.2 in 1950, about 79 today).
- Bell and Miller, Life Tables for the United States Social Security Area, for life expectancy from age 20.
TS120